Digital Twin: From Descriptive to Informative Twin at CO Architects
By Chikara Inamura
What is Digital Twin?
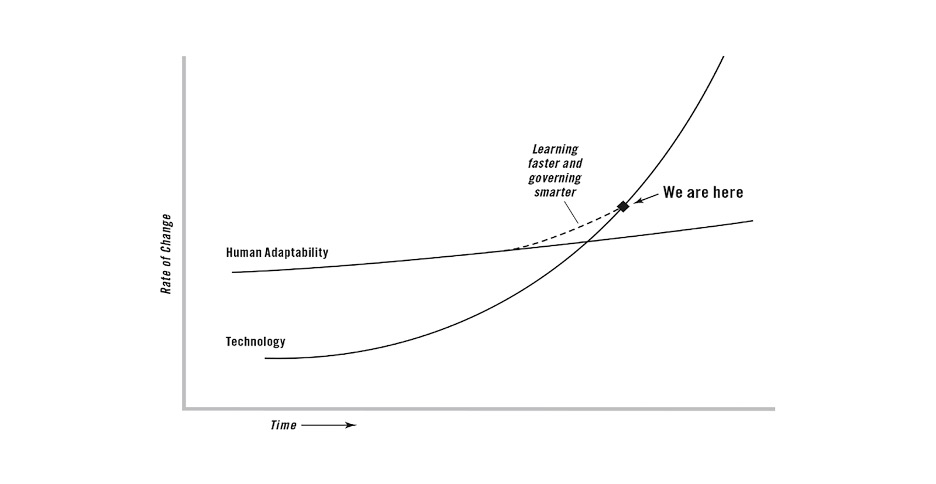
Nowadays, many of us feel that technology is evolving faster than our own ability to adapt to the changes it brings. Eric “Astro” Teller, the CEO and “Captain of Moonshots” at Google X, explains this phenomenon in The New York Times’ columnist Thomas Friedman’s book, Thank you for Being Late. Teller draws a comparison between the exponential rate of change in technology based on Moore's law and a relatively constant rate of change in humanity – both individuals and society – to adapt to changes in its environment. Digital Twin is a good example of this phenomenon, where the development of its enabling technologies and infrastructures is accelerating at such an increasing speed that it is nearly impossible to draw a clear definition of its capabilities, let alone its full potential values to our society. Digital Twin technology has been used in everything from the Apollo 13 mission to agriculture to healthcare, consumer retail and construction. A Digital Twin is the virtual representation of the built environment that can collect real-time data to give insight throughout the lifecycle of a project.
Digital Twin at CO Architects
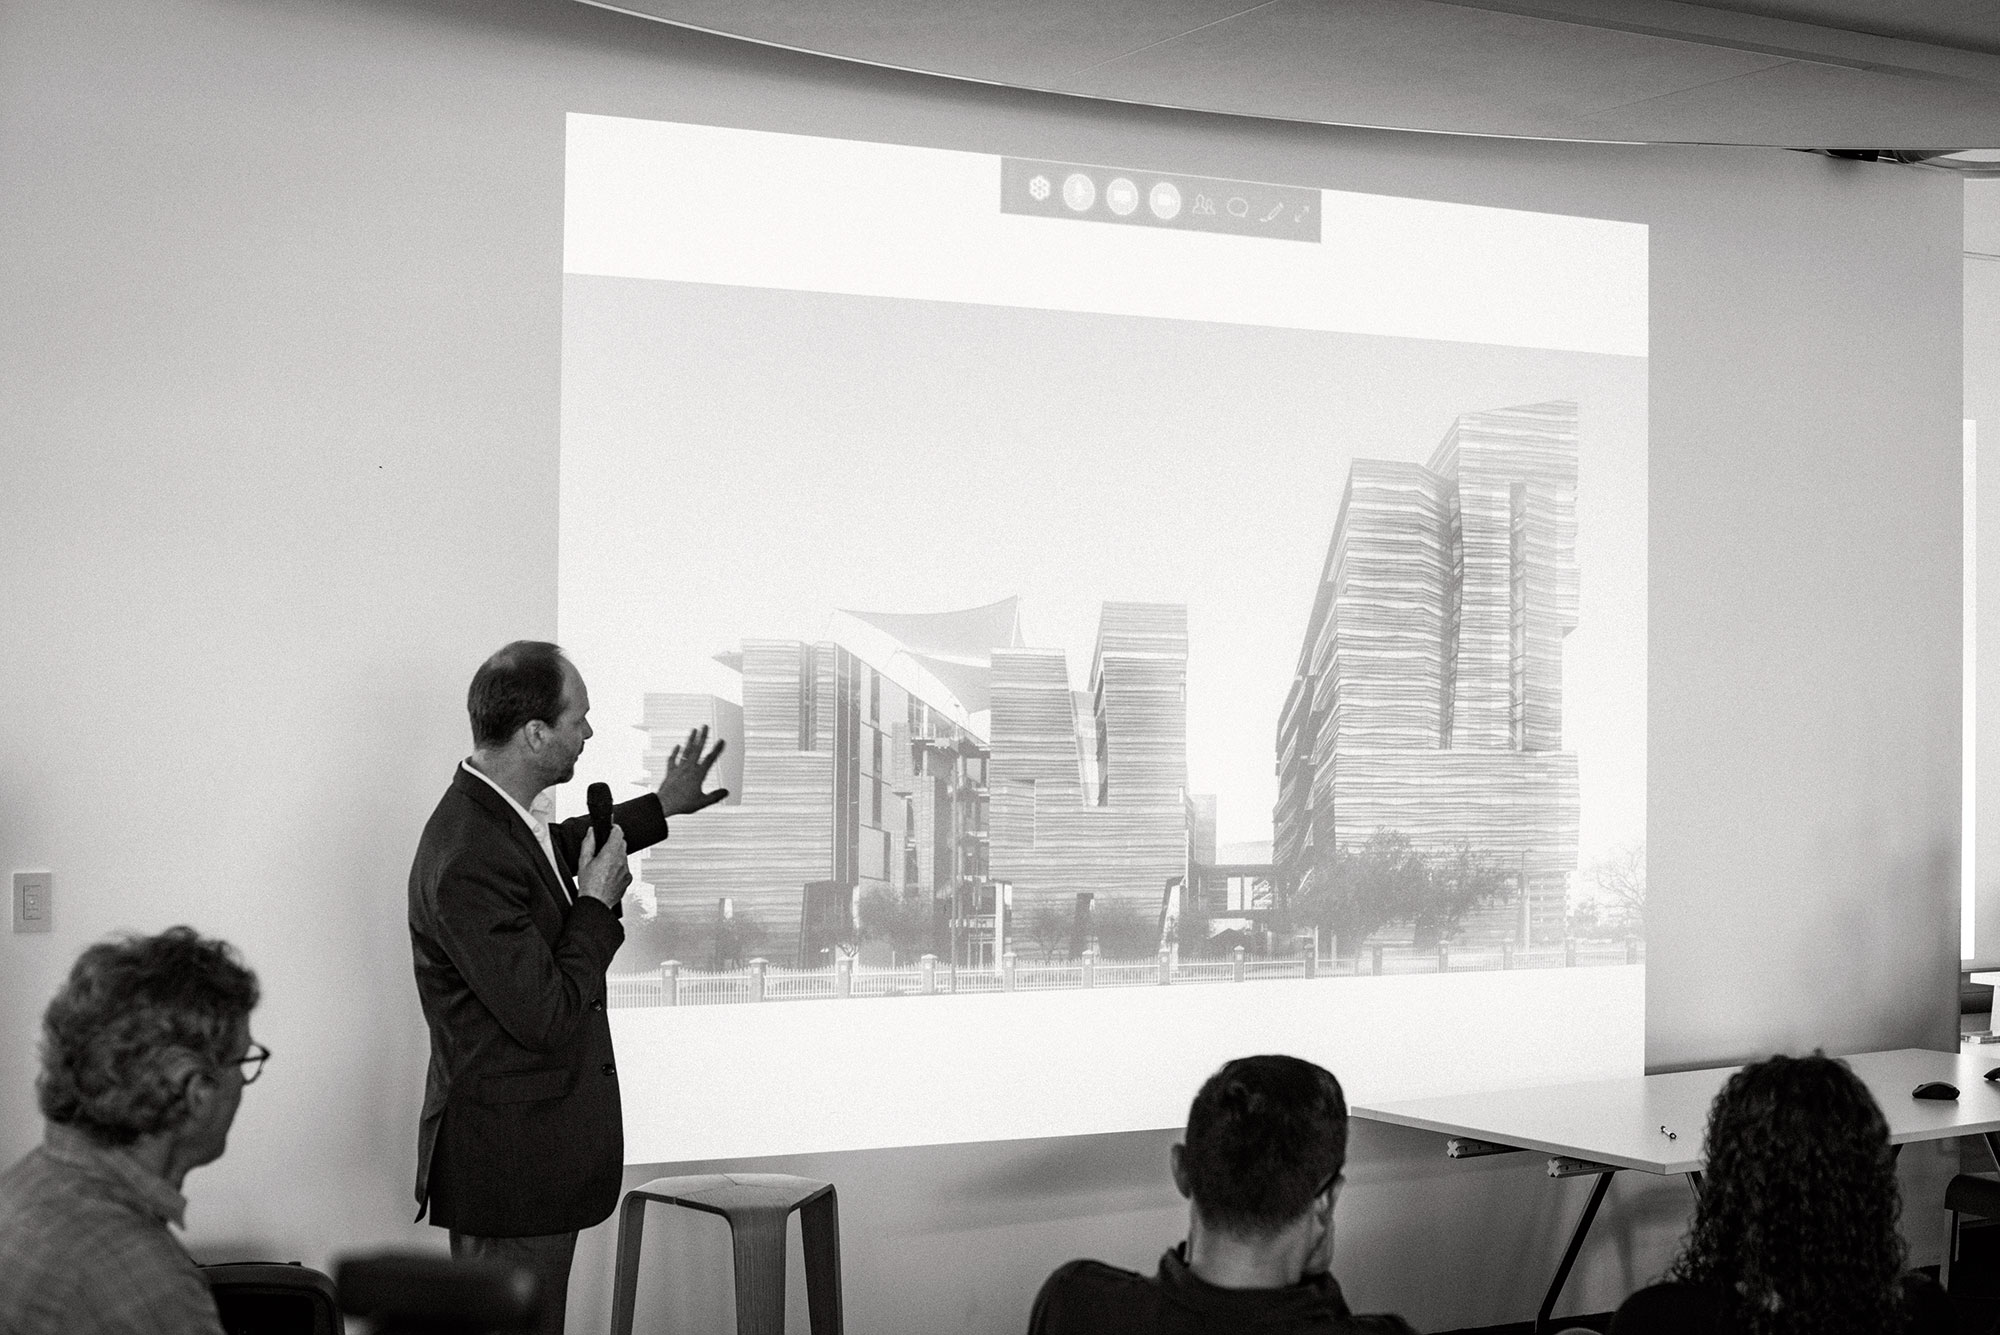
CO Architects recently relocated to a new office space in the Wilshire Courtyard. Designed by our own team of architects and interior designers, we became the client as well as the tenant of our own design, and this unique opportunity turned our new office into an experimental sandbox to implement various Digital Twin solutions. Adapting the 4-stage description by AWS, we identified our initial exploration as the following two case studies:
Descriptive Digital Twin - A Time Machine
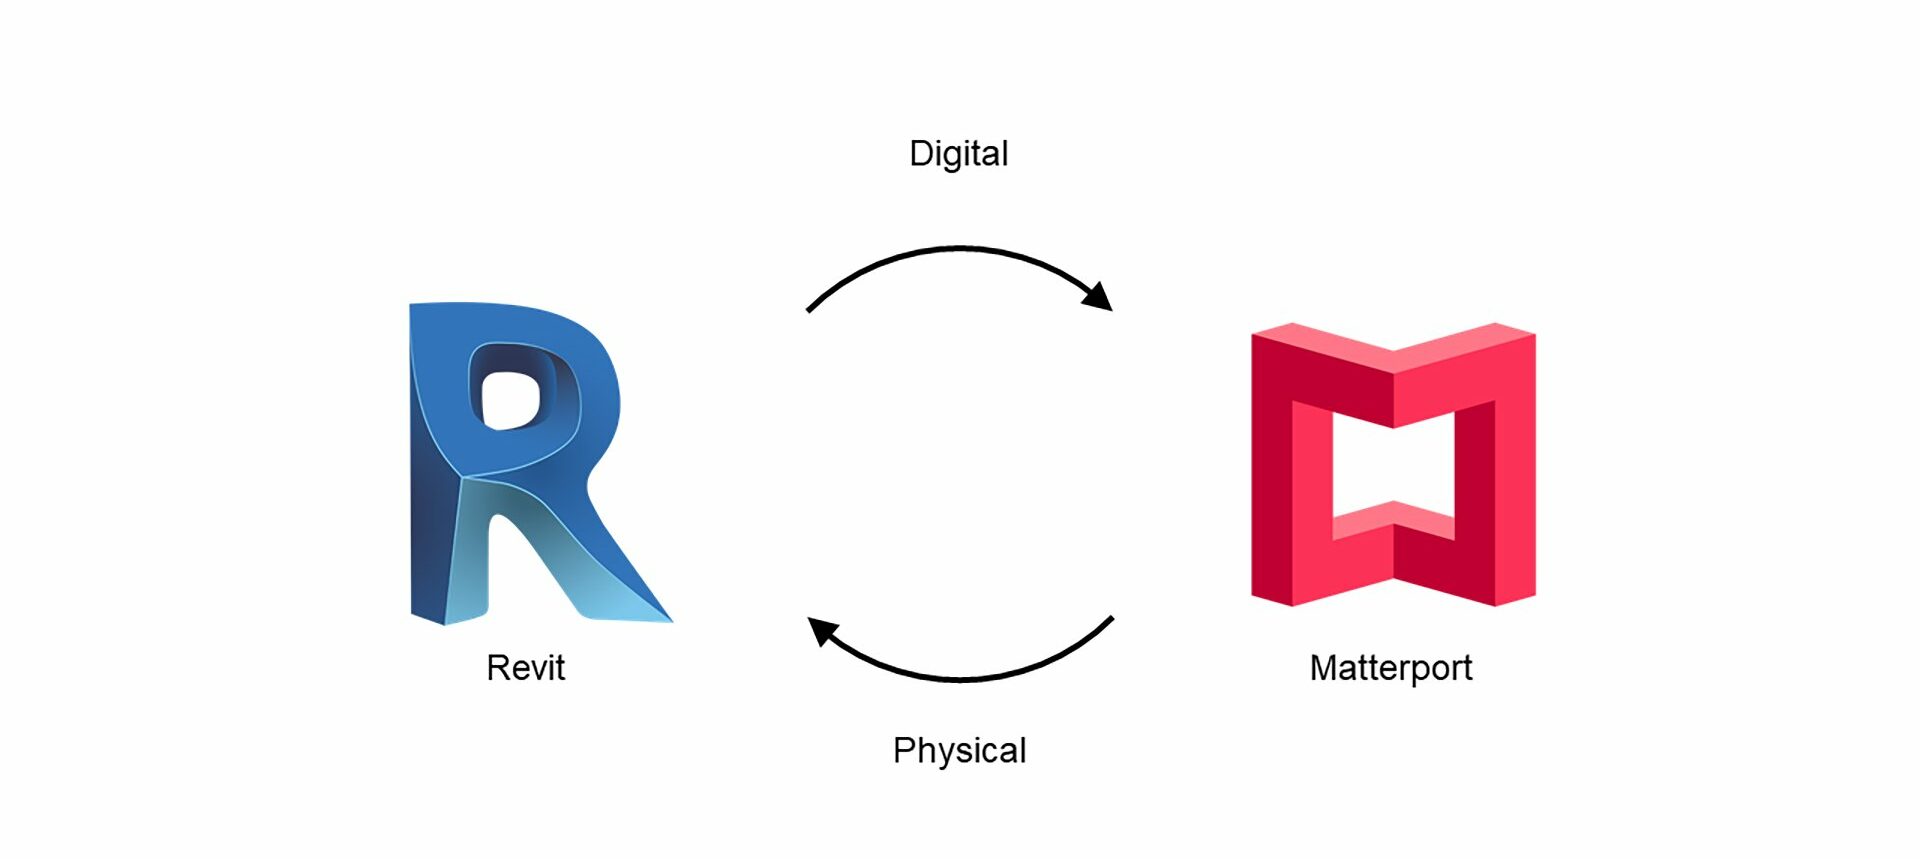
Our goal for the first case study was to explore the concept of a virtual time machine. This digital solution captures a series of time-stamped, 3D-scanned data at various stages of construction and overlays them with a design or engineering CAD models. It allows users to travel forward in time to review design finishes and materials during construction, as well as to travel back in time to uncover building structures and service elements behind finished walls. The idea of archiving spatial data and making it readily available as 3Dl datasets for future reference is exciting and important for us as we plan on making continuous improvements in our built space to accommodate future growth. We used Matterport to 3D scan our new office space at a monthly cadence during construction. Matterport has proved to be highly effective for remote working, as the project team was able to conduct virtual walkthroughs to stay connected with the progress at the site.
After gathering 3D-scanned data from different phases of construction, we brought them into Unity, a game development software, along with the design CAD model from Revit and keyframed each scanned data based on its time stamp. This has essentially become a 4D record of the construction with dimensionally accurate 3D point-cloud data from each phase. Using the game engine, we reconstructed a virtual walkthrough of the construction site with the ability to travel in time to reveal the hidden elements behind the finished walls.
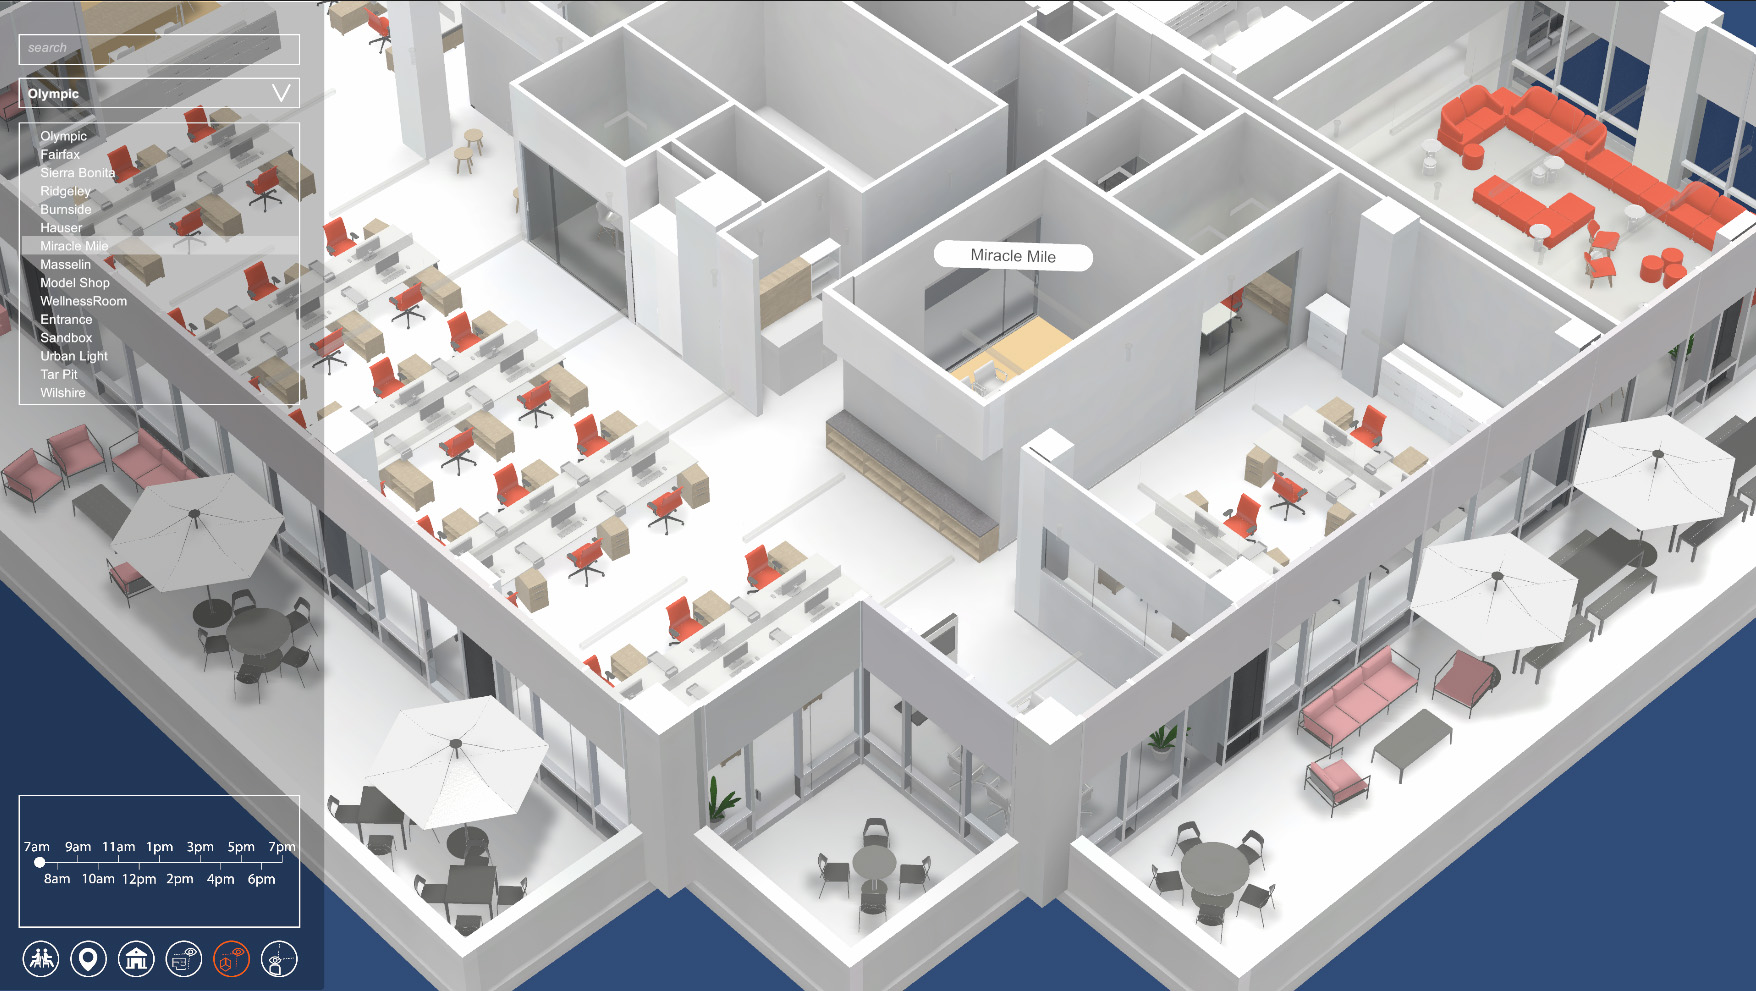
Informative Digital Twin - Live POE Dashboard
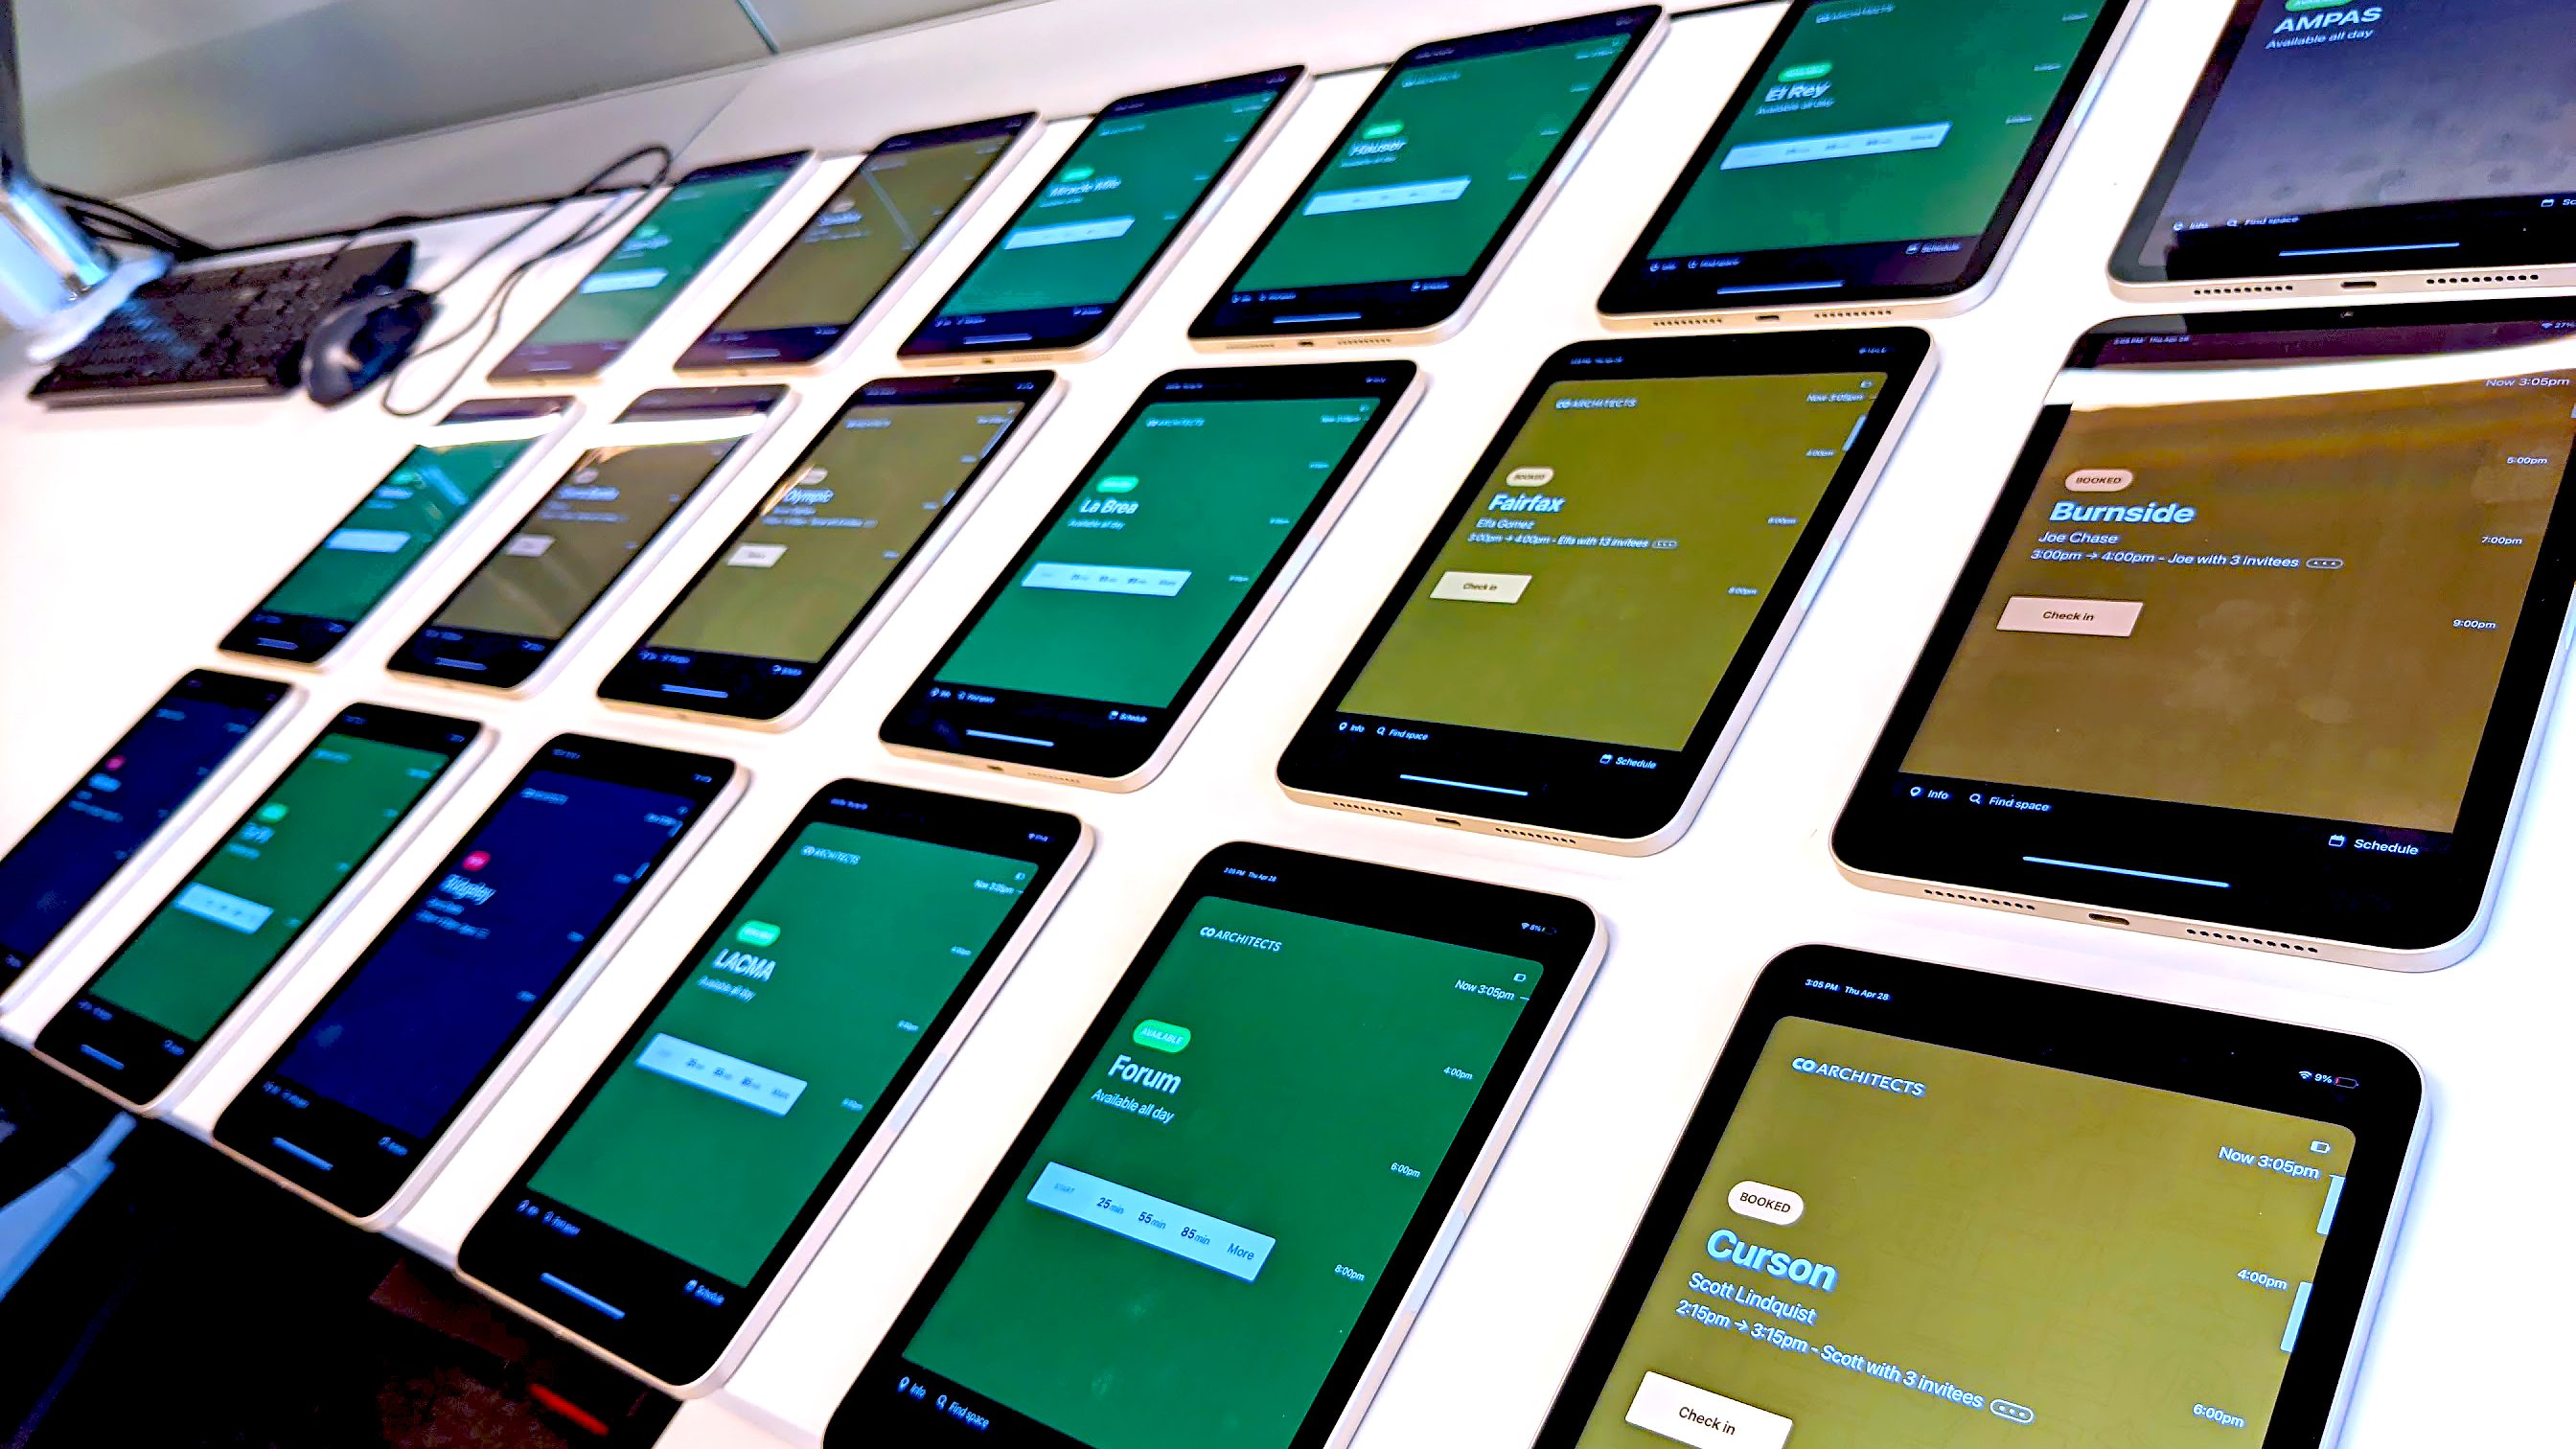
Our second case study on Digital Twin focused on the post-occupancy phase and creating a spatial dashboard that assembles and displays various environmental performance and user activity data from IoT sensors. It is essentially a digital dashboard for post-occupancy evaluation that can be run continuously throughout the lifecycle of the building. This type of Informative Digital Twin can provide various key performance indicators (KPI) of design parameters, such as room sizes, locations, adjacencies and finishes by comparing usages and activity data against environmental performance metrics such as daylight, acoustics, temperature and humidity.
After installing the physical interface in each room, we transferred the usage data into Unity to visualize and evaluate it against other spatial metrics and environmental data. As a proof of concept, we connected our virtual office environment with live data from a local weather station using a web API call. The room booking interface allows us to send out custom prompts to each room and retrieve user feedback on qualitative data pertaining to user preference and comfort. Our next step is to integrate user feedback with various quantitative data using IoT sensors to identify the key metrics of our design and how they relate to our comfort and activities.