Shaping a Roof with Solar Analysis
By: Seth Barnard
At first glance the shape of the Cal Poly Pomona Student Services Building roof appears random. Madness, you say, but look closely–there’s a method to its madness. The movement of the sun plays a key role in sculpting the undulating steel hat. In order to maximize the energy performance of the building, we performed an in-house solar analysis using a highly optimized daylighting and energy modeling plug-in for Rhino 3D called DIVA. And, like any diva that requires a lot of attention, there’s a wonderful payoff. The roof’s morphology has the potential to significantly reduce the building’s energy use intensity, i.e.loads generated by fans, pumps, cooling, heating and lighting via passive design strategies. With 60-foot-wide plates, the ARB has the potential to provide naturally-lit working spaces for the majority of the eight-hour work period, which means happy employees and a lower energy bill.
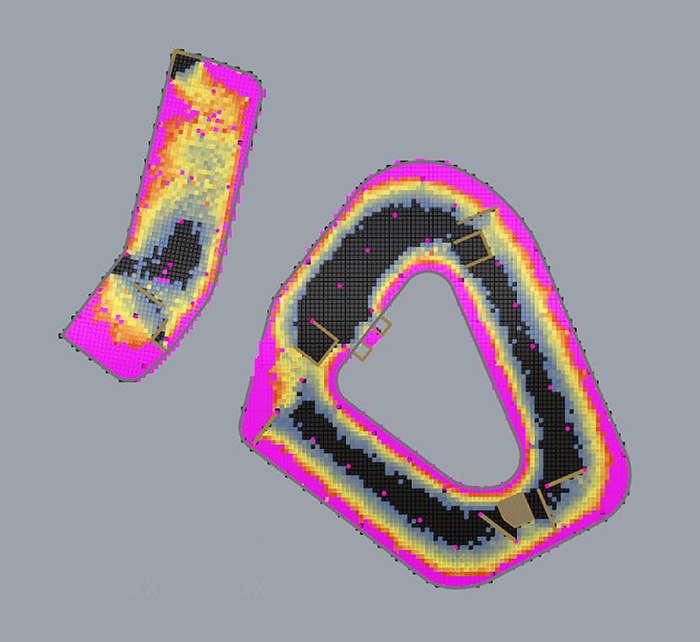
The goals of the analysis are to provide a roof that shades the summer sun, embraces winter warmth, provides natural daylight to workspaces, and reduces the energy load of the building. The analysis itself is relatively simple: DIVA analyzes the building geometry created in Rhino and spits out graphic and numerical solar measurements. Before the simulation runs, the user enters geographic coordinates, defines a sensor node grid (field of measurement), and finally, applies material attributes to the model.
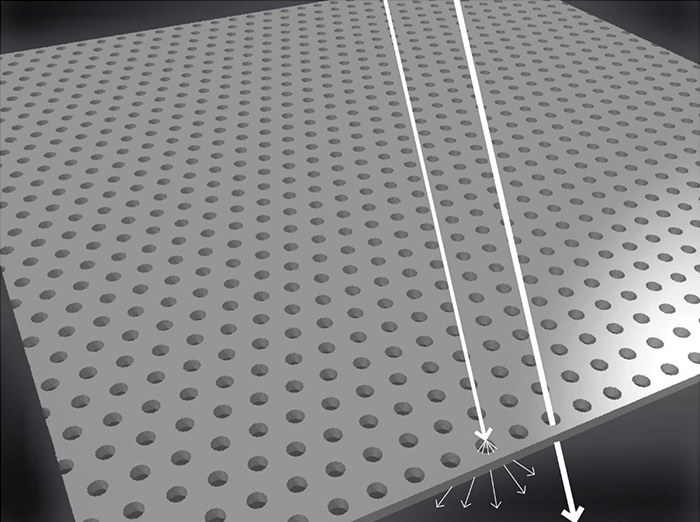
If only it were that easy. DIVA is a diva and only comes with a handful of generic materials to simulate (“metal,” “outside ground,” “generic interior wall,” etc.), which created the need to create custom materials, like the Kalzip perforated standing seam panel. These custom materials also needed to have specific perforation percentages specified by Kalzip- a simple material with complex optics. This involves finding the Bidirectional Scattering Distribution Function (BSDF), specularity and roughness of the given material, learning the code language of the radiance material library, and translating visual attributes into numerical data. For me, this reinforced the idea that almost everything can be described through numbers; words (reflectance, texture, color, secularity, roughness) are translated into numbers for the computer.
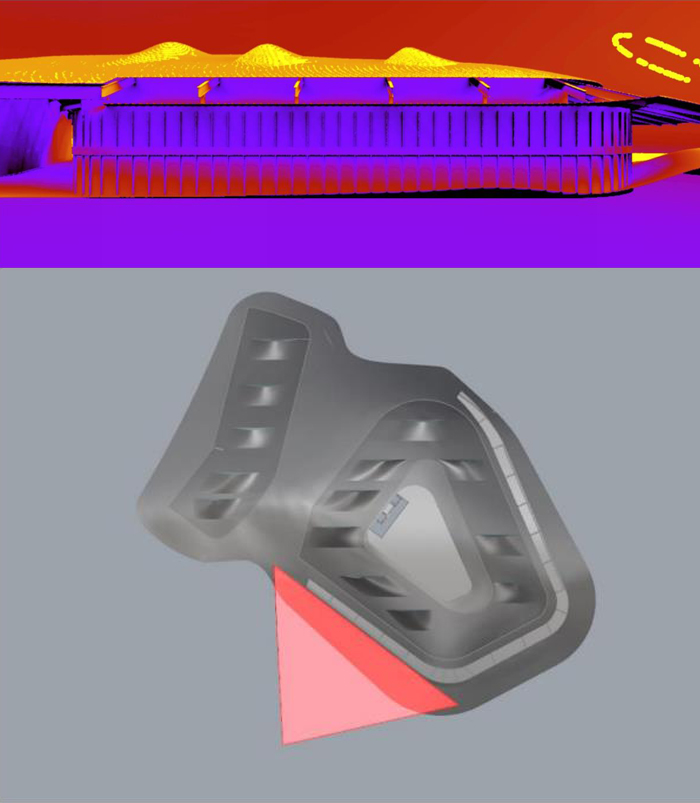
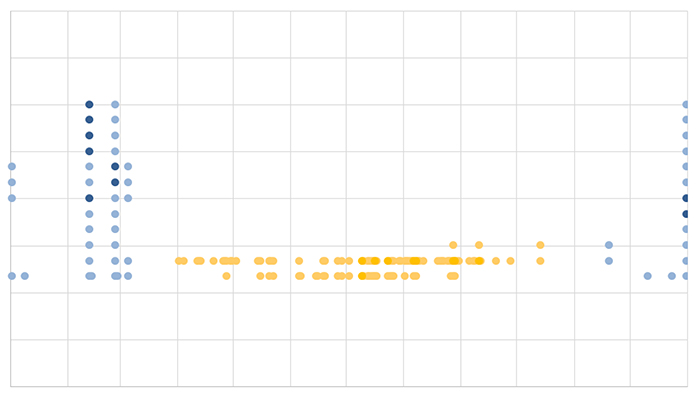
As you know, a DIVA requires lots of attention and time. Each simulation takes about an hour to run. Two computers were used to compare the results of two different perforation percentages: 32% and 16%. It was like playing musical chairs over the course of a few days, hopping back and forth to collect the data. Knowledge of optimal light levels for specific functions was essential in order to understand the results of the investigation and create a baseline for comparison. The ARB requires light levels equivalent to an office building–between 300 and 1000 lux. Although this window seems large, it is actually a very small range to hit when exterior light levels can reach 50,000 lux. Ultraviolet false color images form the results and provide a general perspective of the geometry’s solar performance- the colors are generated by the quantity of light hitting the node grid, which has a color range applied to it. The numerical results provide specific data on the quantity of light at every node in the grid.
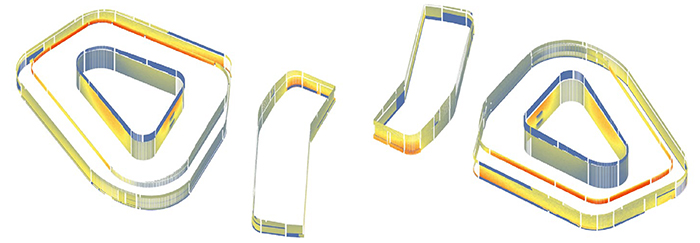
When one sees the psychedelic ultraviolet images, the information is intuitive; where one sees lots of red, that area is over-exposed (over 1000 lux) while blue areas are under-exposed (under 300 lux). Identifying these extremes allowed us to push and pull the roof overhang. In locations where the overhang needed to exceed 25 feet–the structural limit–other solar mitigation solutions were introduced, such as fritted glass and automatic shades.
Although DIVA performs an array of solar analyses, we focused on Daylight Factor, Point-In-Time-Illuminance, Radiation Maps, and Point-In-Time Glare to inform the design. Daylight Factor is a ratio that represents the amount of illumination available indoors relative to the illumination present outdoors at the same time under overcast skies. The higher the factor, the more natural light is available in the room. Daylight Factor is typically measured 30 feet off of the floor plate to gather light levels at a working surface. This analysis reveals the building’s solar performance in relation to light levels- without reference to time.
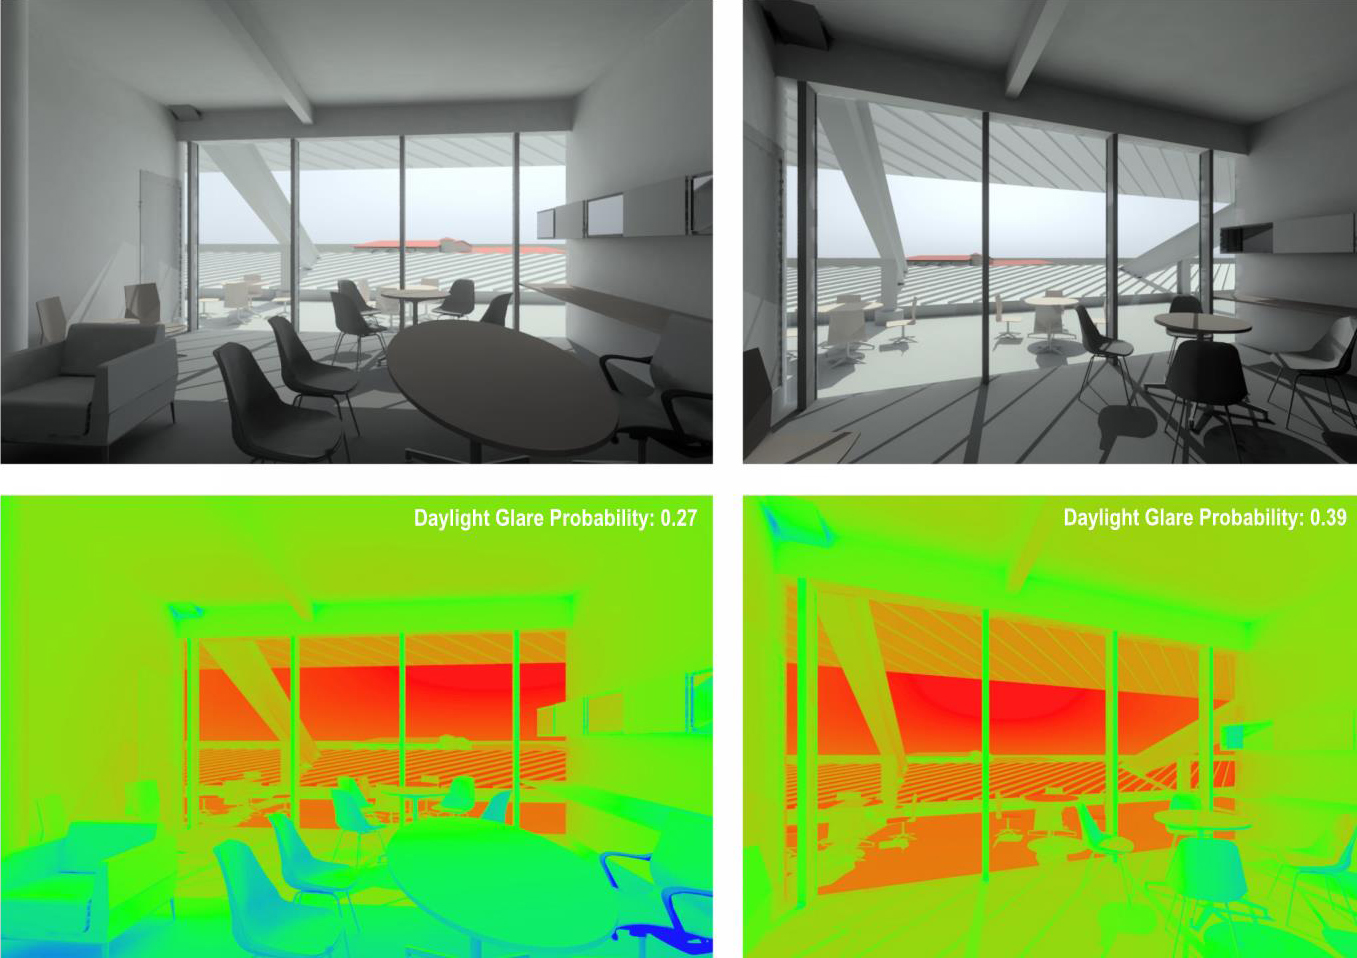
Point-In-Time Illuminance expresses light measured as it falls on a surface at an instantaneous point in time, expressed in lux or foot-candles. Most electric lighting criteria are developed using this metric. To provide an annual picture of the building’s performance, we tested the solstices and the equinoxes.
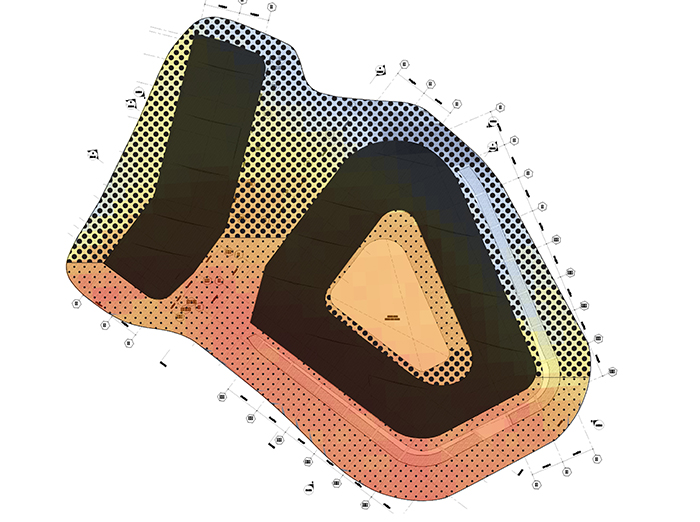
The analysis taught me to think objectively and deductively, and momentarily provided a glimpse into the world of the scientist. The solar analysis emphasized the idea that design is not only intuitive and subjective but also deductive and rational. Design often lives in a gaseous world of theory and morphology; this process was the opposite, presenting a scientific approach that married morphology with data. Although it can be temperamental, DIVA can help optimize our designs if you give it a little love.
See our previous post on the Cal Poly Pomona ARB roof here

